The monthly report is the task every project manager dreads: export the data, paste it into a template, reformat the charts, write the narrative, fix the formatting again, and send a PDF that's already out of date. Nahla replaces that whole ritual. A report is something you assemble from your live schedule in a few minutes — and share as a link that stays current.
The entire flow lives in Analyze mode, and it comes down to four moves: write or click to generate, customize in the preview, and generate the link. Let's walk through each.
Open Analyze mode
Analyze · Read-only
Start by uploading a Primavera P6 or MS Project file, or open a project you've already loaded. Nahla parses the schedule and builds an interactive dashboard — KPIs, charts and the AI assistant — automatically. Because Analyze is read-only, everything you do here is audit-safe: building a report never touches the underlying schedule.
That's the only setup. There's no separate "reporting module" to configure — the report is built from the same project you're already looking at.
Write or click to generate the sections
There are two ways to fill a report, and you can mix them freely.
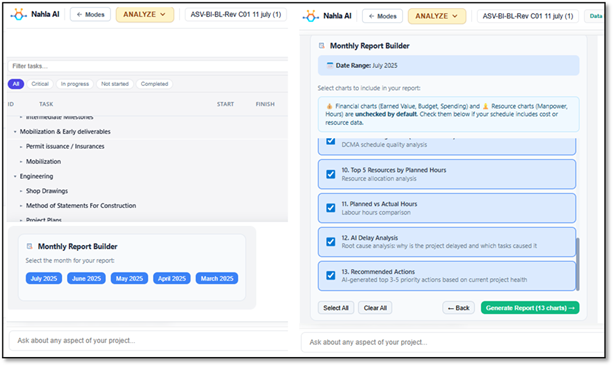
Click to generate
The fastest route is the one-click section templates. Add an Executive Summary, a Monthly or Weekly report, an Earned Value section, or a Monte Carlo risk summary, and Nahla generates each with the right charts and an AI-written narrative drawn from your schedule. Pick the templates you need and they drop straight into the report.
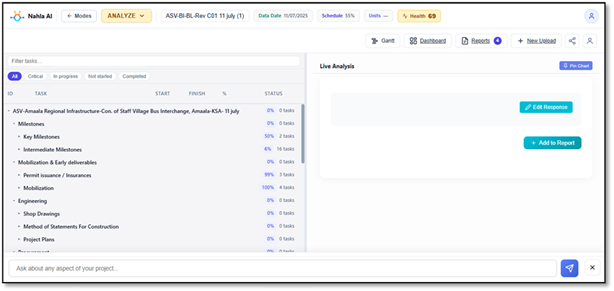
Write to generate
For anything specific, just ask. Type a question to the assistant — "show the critical path tasks", "what slipped this month?", "manpower histogram by trade" — and pin the answer to your report. Pinned charts and Q&A become report sections, so the report ends up reflecting exactly the questions that matter to this project, not a fixed template.
Click for the standard sections, write for the specific ones. The report accumulates from your conversation with the schedule.
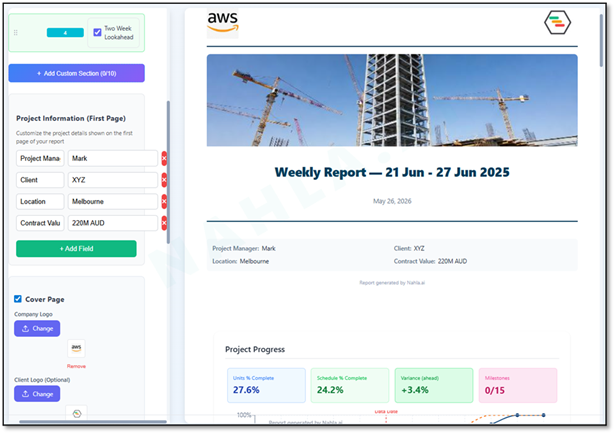
Customize everything in the preview
As sections accumulate, they appear in a live preview — exactly what your reader will see. This is where you make it yours:
- Reorder and edit sections. Drag sections into the order you want, edit the AI-written narrative, and remove anything that isn't relevant.
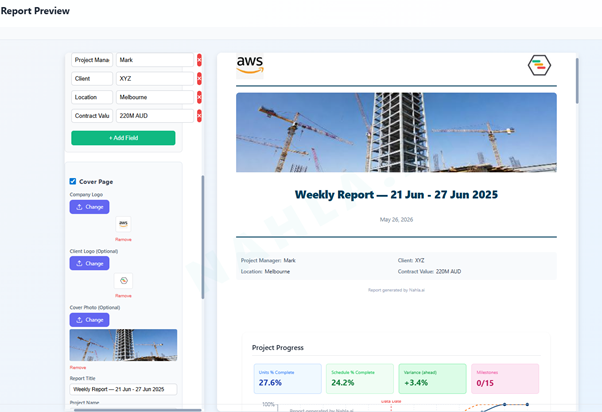
- Brand it. Upload your company logo (PNG or JPG) and the report carries it on the cover and header. Set the project name, dates and the project manager so it reads as your document.
- Set the cover. The cover header — logo, title and reporting dates — sits at the top, giving the report a polished, client-ready first page.
- Choose the link scope. Decide whether the shared link shows the full report or just a single locked view — useful when you want to send one chart without exposing everything.
You can save the report as a draft at any point, come back later, and version it freely without breaking anything. Nothing is final until you choose to share.
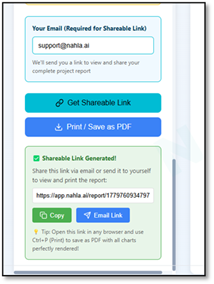
Generate the link
When it looks right, generate a live shareable link. Send it to anyone — clients, executives, the site team — and they open it in a browser with no login and no scheduling software required. The charts stay interactive and the tables expand and collapse, so it's a living view, not a flat PDF.
Because the link is live, it reflects the latest schedule whenever it's opened — no more re-issuing a report every time the data changes. Prefer a static artifact? You can still export to PDF or Excel and walk away with a snapshot. And if you used the single-view scope, the recipient sees only that one locked view.
Four steps, every reporting cycle
1. Open the project in Analyze mode. 2. Write or click to generate the sections — templates for the standard parts, pinned Q&A for the specific ones. 3. Customize in the live preview: reorder, edit, brand, set the cover and the link scope. 4. Generate a live link, or export to PDF/Excel.
The takeaway
Reporting shouldn't be a day of formatting that produces something stale on arrival. In Nahla it's a few minutes of writing and clicking inside the mode you're already working in — and the result is a branded, interactive, always-current link instead of a PDF that's wrong by lunchtime. Build it once, share the link, and let it stay live.